
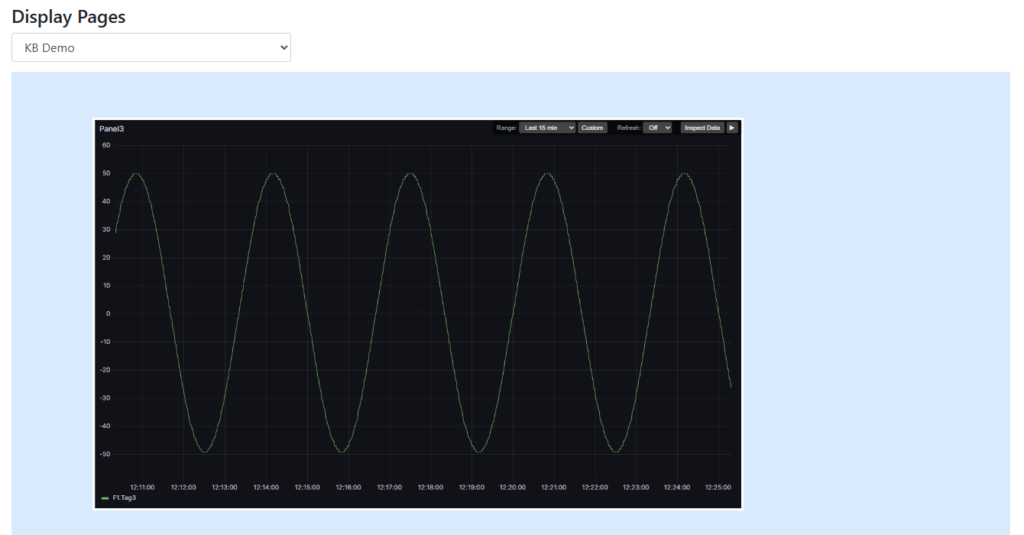
This article describes how to put a Grafana dashboard panel on a Nova display page using the Grafana Panel primitive. It covers what the Grafana container provides, how to copy a panel link out of Grafana and import it in one step, every setting the primitive exposes, and the toolbar the viewer sees at runtime. Settings are referred to by the names shown in the configuration UI.
How the Panel Reaches the Display
The Grafana Panel primitive shows a panel from the device’s own Grafana, self-hosted, instance rather than an outside web page, and Nova serves that panel to the display itself. Three things follow, and together they are why this primitive exists rather than a plain Web Page primitive aimed at Grafana:
- Viewers never sign in. A display on a kiosk, a wall panel or an anonymous HMI session renders the panel with no Grafana login of its own;
- A display page cannot change anything. What it shows is read-only: a dashboard cannot be edited, a data source cannot be changed, and Grafana’s administration pages are not reachable this way; and
- The device’s own address is used. The link you import identifies the dashboard and the panel, never the host. A link copied from Grafana in your office browser therefore works unchanged on any device that has the same dashboard, and nothing has to be re-pointed when a configuration is copied from one device to another.
Before You Start
- The Grafana subsystem must be enabled and running. Its link appears on the device’s Links dropdown, which is also how you reach Grafana itself to build dashboards;
- The dashboard must be saved in Grafana. A dashboard that has never been saved has no UID, and there is nothing for the primitive to address; and
- The panel should be showing data when you view it in Grafana. Nova provisions an InfluxDB data source named Nova-Influx into Grafana for you, so a dashboard built on that source needs no further setup.
You do not need to enable Allow Embedding on the Grafana container’s User Access page for this primitive.
Adding the Primitive to a Page
- Open the display page in the editor and add a primitive.
- Choose Grafana Panel from Core Primitives in the picker.
- Drag and size the rectangle where the panel should appear. Size it generously — a Grafana panel drawn into a small box is legible only at a high Panel Zoom, covered below.
Until it is pointed at a dashboard the primitive shows a grey placeholder carrying its type and name, both in the editor and on the page.
Importing a Panel from Grafana
Everything that identifies a panel — its dashboard, its panel number, the theme, the time range and the refresh rate — is carried in the link Grafana gives you, so the whole configuration is a copy and a click.
Copy the Link in Grafana
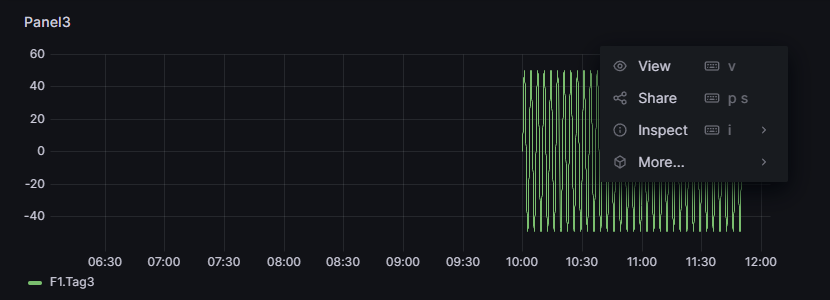
- Open the dashboard in Grafana and hover over the panel you want.
- Open the panel menu and choose Share.
- Use the Embed tab and Copy to clipboard. The Link tab works equally well — the import accepts either — and so does the address bar of a dashboard opened with a single panel in view.
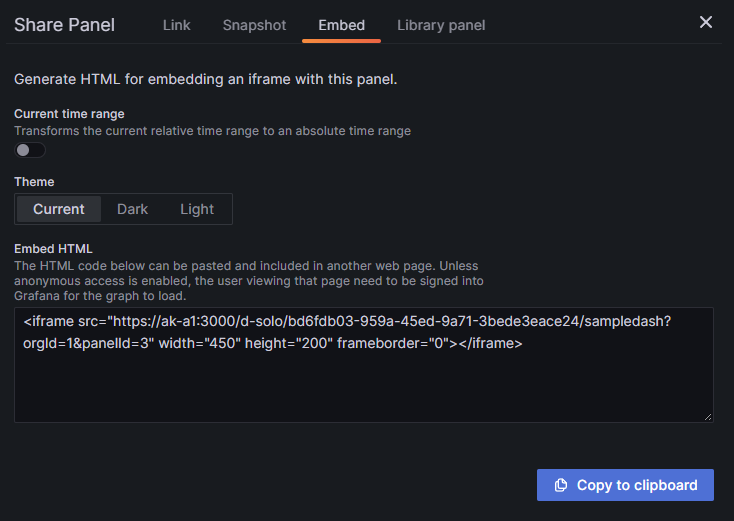
The Embed tab hands you a whole <iframe src="..."> snippet. Paste it in as it comes; the import takes the address out of it for you.
Turn off Current time range before copying, unless you mean to pin the panel to a fixed span. That switch is on by default on the Embed tab, and it rewrites the dashboard’s rolling window — Last 6 hours — as the two absolute instants it covered at the moment you copied. Imported, those land in From Override and To Override, and the panel then shows that same fixed afternoon for ever. With the switch off the link keeps the rolling window and the import sets Default Time Range instead.
Import It in Nova
- Select the Grafana Panel primitive in the editor and open its Panel tab.
- Under Source, click Import From Clipboard.
The browser will ask for permission to read the clipboard the first time. If permission is refused the import reports that it could not read the clipboard; grant it in the browser’s site settings and click the button again.
On success a confirmation appears and the fields below are filled in.

What the Import Fills In
| Source | Field | Notes |
|---|---|---|
| Dashboard UID | Dashboard UID | The only part that is strictly required |
| Dashboard name in the path | Dashboard Name | Cosmetic; it makes the address readable and the primitive’s placeholder recognisable |
| Panel number | Panel ID | Read from an embed link, from a dashboard link with a panel in view, or from a link copied in the panel editor |
theme | Theme | Light or Dark |
kiosk | Chrome | Normal, Kiosk or TV |
refresh | Refresh Interval | Only the intervals the setting offers; anything else comes in as Off |
from and to | Default Time Range, or From Override and To Override | A range that matches one of the presets sets the preset; anything else — including an absolute time — goes to the override fields on the Advanced tab |
| The host | nothing | Ignored, so the page always uses the device it is served from |
An import overwrites these settings and leaves every other setting alone, so re-importing after changing a panel in Grafana is safe. Because the panel number, the theme and the time range are all re-read, an import is also the quickest way to undo a set of experiments on the View tab.
When the Import is Refused
| Notification | Meaning |
|---|---|
| The clipboard does not hold a Grafana panel link | The clipboard held something that is not a Grafana address. Copy the link again from Grafana’s Share dialog |
| That dashboard has not been saved in Grafana yet | The link came from a new, unsaved dashboard, which has no UID. Save it in Grafana and copy the link again |
| Imported, but that link was copied while the panel was open in the Grafana editor | The import worked, but the panel number came from an editing session. If those edits are abandoned the number can move, leaving an empty frame. Save the dashboard in Grafana and check Panel ID |
Panel Settings — Source
| Setting | Values | Effect |
|---|---|---|
| Dashboard UID | Expression | Identifies the dashboard. Required |
| Dashboard Name | Expression | The readable dashboard name. Optional, and not used to resolve the dashboard |
| Panel ID | Expression | The single panel to show. Leave it empty to show the whole dashboard rather than one panel |
| Import From Clipboard | Button | Fills the settings above, and several on other tabs, from a copied Grafana link |
All three are expression fields, so a panel can be selected by a tag rather than fixed in the configuration — one page can serve a different dashboard per site or per unit. The import always writes plain literal values. Those arrive in quotes — "sampledash", "3" — which is simply how an expression field shows a fixed piece of text, and is normal.
Panel Settings — View
Presentation
| Setting | Values | Default | Effect |
|---|---|---|---|
| Theme | Light, Dark | Dark | Grafana’s own rendering theme. Pick the one that suits the display page, not the one Grafana happens to use |
| Chrome | Normal, Kiosk, TV | Kiosk | How much of Grafana’s own furniture appears. Only meaningful when Panel ID is empty and a whole dashboard is shown; a single panel has no chrome to hide |
| Default Time Range | Last 5 min through Last 7 days | Last 6 hours | The window the panel opens on |
| Refresh Interval | Off, 5s, 10s, 30s, 1m, 5m | Off | How often Grafana re-queries. Leave it Off on pages that are already busy, and remember that every open display refreshing at 5s is load on the device |
| Panel Zoom | 50 to 400 % | 100 % | Magnifies everything the panel draws |


Toolbar
| Setting | Values | Default | Effect |
|---|---|---|---|
| Show Toolbar | Checkbox | On | Shows the viewer’s range and refresh controls over the panel |
| Toolbar Height | 16 to 200 px | 28 px | The height of that bar. Available only when the toolbar is shown |
Panel Settings — Advanced
Time Range Override
| Setting | Values | Effect |
|---|---|---|
| From Override | Expression | Start of the window, replacing Default Time Range |
| To Override | Expression | End of the window |
Both accept either of the two forms Grafana itself uses: a relative time written as text, such as now-90m or now-2d, or an absolute time as a Unix timestamp. The timestamp can be in seconds or in milliseconds. Grafana needs milliseconds, so Nova converts a time in seconds before passing it on. Being expressions, they can come from tags — a page can show the window around a batch, a shift or an alarm rather than a fixed span. A tag that holds a time in seconds works as it stands.
An override is applied when the page loads and whenever the configuration changes, not continuously. Treat it as the window a page opens on rather than as one that keeps tracking.
A timestamp typed on its own is shown as a date and time, followed by (UTC) or (Local) according to the Time Zone chosen under User Options. A clock icon beside it opens a calendar and time picker. Pick a date there, or type over the date in the same layout, and the field stores the Unix number again, in the unit it already held. Hover over the field to see the number that is stored.

Only a plain number that falls between the years 2000 and 2099 is shown this way, and the field tells seconds from milliseconds by size. A relative time such as now-90m, an expression or a tag reference is left as it is. An empty field has no unit to follow, so typing a date into it gives the error Not a time. Enter the timestamp as a number first, then change the date.
Extra URL Options
| Setting | Values | Effect |
|---|---|---|
| Refresh on Change | Checkbox | Reloads the panel when a dynamic option’s value changes |
| Static URL Options | Table of name and value | Extra parameters passed to Grafana as written |
| Dynamic URL Options | Table of name and expression | The same, with the value coming from an expression |
These tables are how a dashboard’s template variables are driven from Nova. Grafana passes a variable as a parameter named var- followed by the variable name, so a dashboard with a variable called line takes an option named var-line. Put it in Static URL Options to fix it for that page, or in Dynamic URL Options — with Refresh on Change ticked — to have the panel follow a tag as the value changes.
Panel Settings — Behavior
| Setting | Values | Default | Effect |
|---|---|---|---|
| Loading Color | Colour | Black | The colour behind the frame before Grafana has drawn. Match it to the panel’s theme so the page does not flash |
| Allow Interaction | Checkbox | Off | Lets the viewer interact with the Grafana panel itself — tooltips, legend clicks, drag to zoom. Leave it off for a kiosk or a wall display, where a stray touch should not change what is shown |
| Scale With Page | Checkbox | Off | Ties the frame to the display page’s own scaling. Tick it when the page is scaled to fit the browser window and the panel should scale with everything else |
Allow Interaction does not affect Nova’s own toolbar, which stays usable either way.
The Runtime Toolbar
Unless Show Toolbar is cleared, the running page carries a small bar over the panel:
| Control | Action |
|---|---|
| Range | Switches the window between the usual presets, or opens a custom picker for an exact start and end |
| Refresh | Changes the re-query interval for this session |
| Inspect Data | Swaps the frame for Grafana’s data inspector, showing the numbers behind the graph. Available only when a single panel is shown |
| The arrow at the end | Collapses the bar to just that arrow, and opens it again |
Choosing Custom in Range opens a picker with a calendar and a list of quick ranges, so a viewer can go to a particular day without leaving the display page.

What the viewer picks here lasts for as long as the page is open and is not written back to the configuration. Reloading the page returns to the configured range.
Exporting the Data Behind a Panel
Inspect Data gives the viewer the same export Grafana offers on the server. The button opens Grafana’s inspector over the panel, with three tabs:
| Tab | Contents |
|---|---|
| Data | Every value behind the graph in a table, and a Download CSV button |
| Stats | What the query cost — how many queries ran and how long they took |
| JSON | The panel definition, the query and the returned data as JSON |
The download covers the range the panel is currently showing, so the viewer sets the window with Range first and then exports it — switching to Last 24 hours and downloading gives a day of values, and a custom range gives exactly that span.

This needs Allow Interaction. The toolbar button is Nova’s own, so the inspector opens either way — but everything inside it belongs to Grafana’s page, and with Allow Interaction cleared the frame ignores clicks. The viewer can read the numbers and nothing more: Download CSV does nothing, and the Stats and JSON tabs cannot be reached. Tick Allow Interaction on the Behavior tab to let them export.
That is the setting to reach for when operators ask for data off an HMI page: they get the panel’s values as a CSV without a Grafana login and without any route to change what the dashboard shows.
How the Time Range Is Decided
Three settings can supply the window, and they take effect in this order:
- Default Time Range — the preset on the View tab, used when nothing else is set;
- From Override and To Override — when either is filled in, they replace the preset; and
- The viewer’s choice in the toolbar — which shadows both, for that session only.
An import from the clipboard writes to the first or the second according to what the link carried: a plain relative range that matches a preset sets the preset, and anything else lands in the overrides.
Troubleshooting
| Symptom | Likely Cause |
|---|---|
| The frame is empty | The dashboard or the panel no longer exists, or the panel number came from an unsaved editing session. Re-open the dashboard in Grafana, copy the link again and re-import |
| The whole dashboard appears instead of one panel | Panel ID is empty. Import the link from Grafana’s Embed tab, which always carries a panel number, or type it in |
| The panel is there but the axis text is unreadable | Raise Panel Zoom. Nothing in Grafana’s own settings will enlarge it |
| Grafana’s menus and header take up half the frame | Set Chrome to Kiosk, or set a Panel ID so only the panel is drawn |
| The page flashes a dark block before the panel appears | Set Loading Color to match the chosen Theme |
| A touch on the panel changes what is shown | Clear Allow Interaction |
| The panel does not follow the page when the browser window is resized | Tick Scale With Page |
| Typing a date into From Override or To Override gives Not a time | The field is empty, so it cannot tell whether to store seconds or milliseconds. Enter the timestamp as a number first, then change the date |
| Nothing renders and the device has just been restarted | Give the Grafana container time to finish starting |
